This article is aboutHuman resources issuesSituation description, model establishment, program flow and results, etc.
(Note: There are many charts in this article, please turn off the "dark mode" to read)

1. Situation description
A company is going through change. The installation of new equipment reduces the demand for low-level workers and increases the demand for high-level workers. In the next three years, the trade situation is predicted to be different every year, and the demand for various types of workers is also different. The company hopes to comprehensively consider recruitment, training, layoffs, short-time work, etc., and formulate policies for the next three years to achieveMinimum number of layoffs, orminimal overhead。
-
Labor demand in the next three years
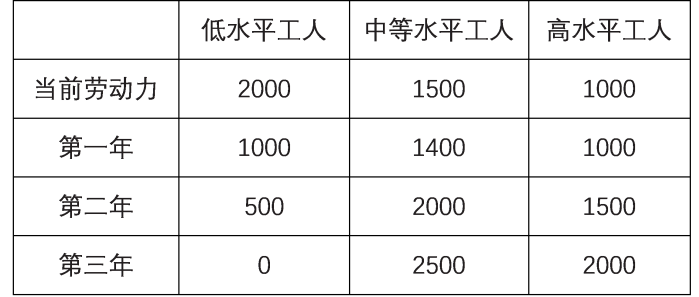
Table 1 Labor demand in the next three years
-
Personnel resigns
Natural labor turnover is high, with many employees resigning within the first year, and turnover rates decrease significantly thereafter.
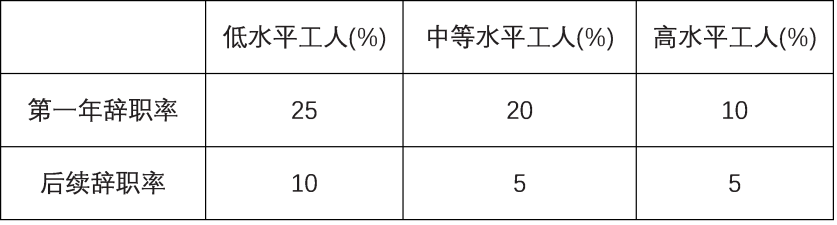
Table 2 Resignation rate
-
Recruitment
There is a limit to the number of people that can be recruited each year.
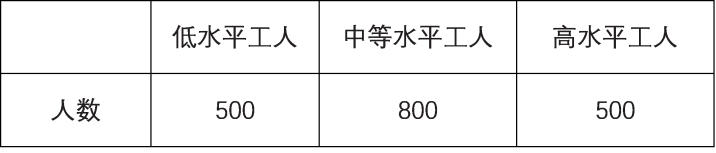
Table 3 Maximum number of people that can be recruited each year
-
training
Through training, low-level and mid-level workers can move up a level.
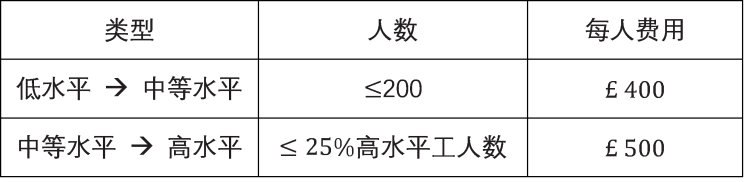
Table 4 Training types, number of people and fees
However, there can also be downgrades, where workers move from a higher level to a lower level. 50% of demoted workers will leave their jobs (these people are not included in Table 2).
-
layoffs
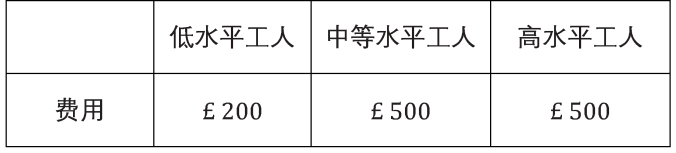
Table 5 Cost per person for layoffs
-
excess manpower
Companies can over-hire up to 150 employees.
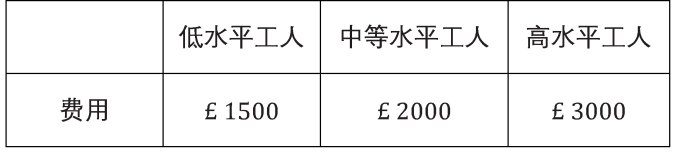
Table 6 Annual cost of excess personnel
-
Shorten working hours
Up to 50 people in each category of personnel can work reduced hours. A short-time employee can only meet 50% of the production needs of a full-time employee.
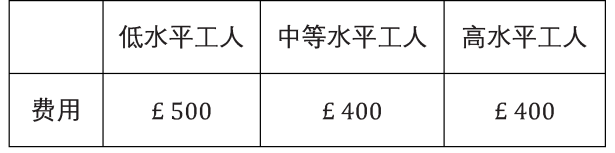
Table 7 Annual cost per person for short-term employees
2. Model establishment
Personnel changes that occur every year:
1. Recruitment of new employees
2. Resignation of employees who have worked for less than 1 year
3. Employees who have worked for more than 1 year resign.
4. Employee training or demotion
5. Layoffs
6. Surplus personnel
7. Short-term employee variables
1. Incumbent personnel
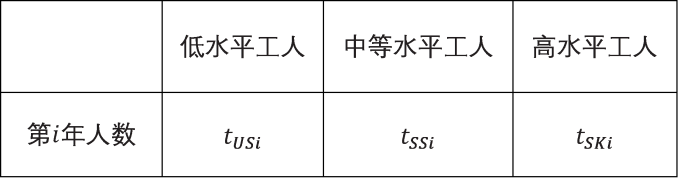
Table 8 Number of employees in year i
2. Recruit people
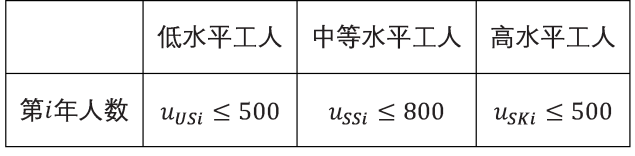
Table 9 Number of people recruited in year i
3. Train personnel
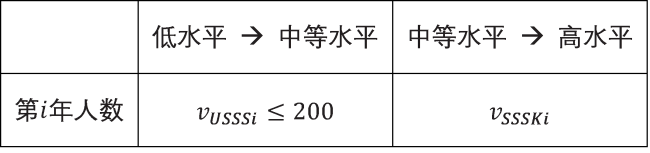
Table 10 Number of people trained in year i
4. Demoted Personnel

Table 11 Number of people downgraded in year i
5. Layoffs
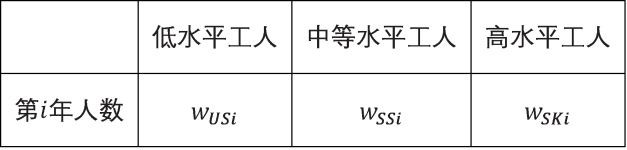
Table 12 Number of layoffs in year i
6. Short-term and long-term personnel
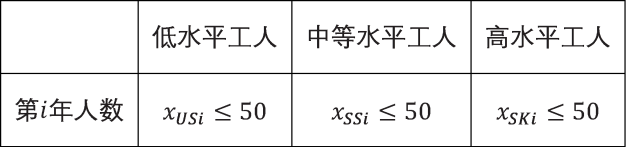
Table 13 Short-term number of people in year i
7. Surplus manpower
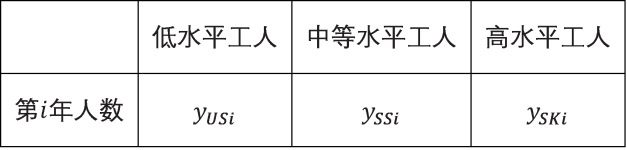
Table 14 Surplus number of people in year i
Equation
1. Initial conditions

2. Two expressions of the number of employees
Number of people in office = number of people who did not resign last year + number of newly recruited people who did not resign + change in the number of people who were trained and did not resign + change in the number of people who were demoted and did not resign - number of layoffs

3. Limitation on the number of people training for mid-level personnel

4. Excess number limit

5. Labor demand
Labor demand = Number of employees - Surplus manpower - Increased number of short-time employees (according to labor force)

Minimum layoffs

Formula (1) represents the total number of employees. To obtain the strategy with the least layoffs, it needs to be minimized.
minimum cost

Formula (2) is the total cost. To get the minimum cost, it needs to be minimized.
3. Program flow
Python programming is used here, and Ortools is used to solve the model.
1. Enter and read the excel table (including parameter size and variable range).
2. Create variables and set the variable range: recruitment number u, training number vup, the number of downgraded people vdown, the number of layoffs w, the number of short-term and long-term employees x, and the surplus manpower y.
3. Add restrictions and calculate the number of employees.
4. Set the objective optimization function.
5. Solve the model, and the final result is rounded (during the solution process, a floating point number that is very close to an integer is produced) output.
4. The result is at least layoffs
1. Recruit people
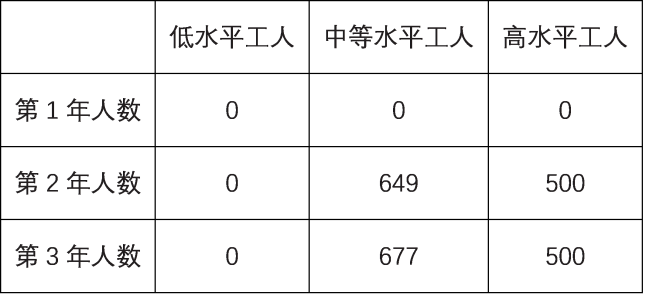
Table 15 (Minimum layoffs) Number of recruits
2. Train personnel
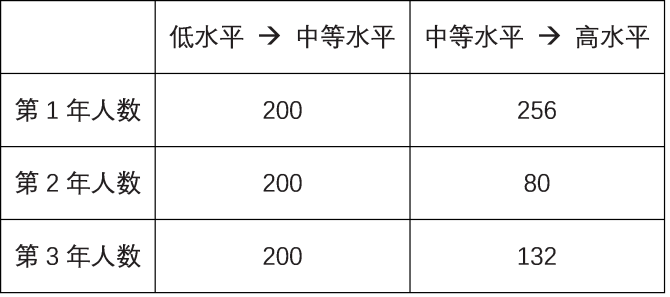
Table 16 (Minimum layoffs) number of people trained
3. Demoted Personnel
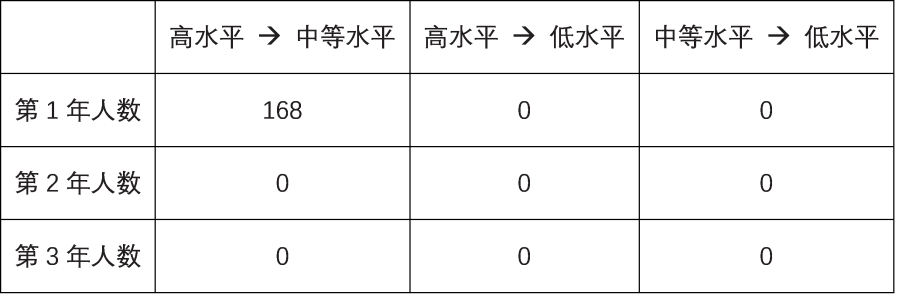
Table 17 (Minimum layoffs) number of demoted people
4. Layoffs
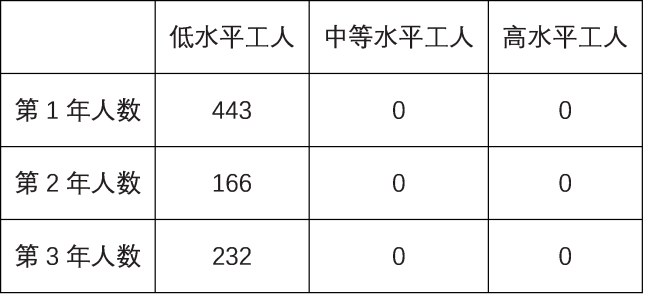
Table 18 (Minimum layoffs) Number of layoffs
5. Short-term and long-term personnel
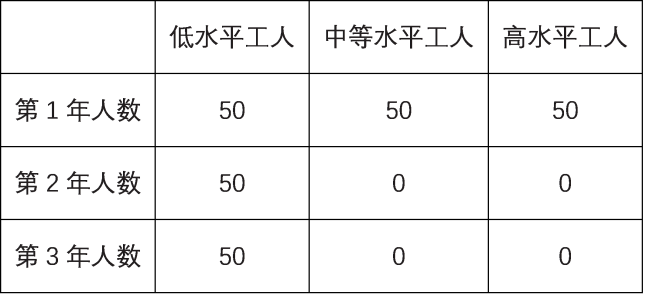
Table 19 (Minimum layoffs) short-term and long-term number of people
6. Surplus manpower
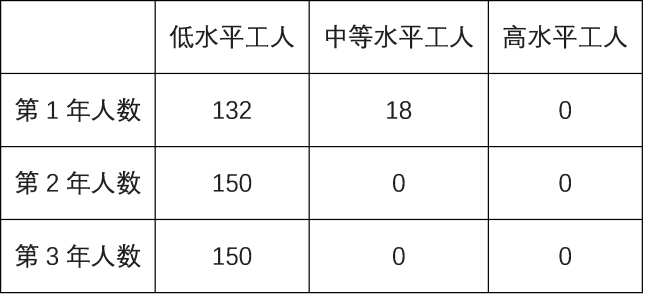
Table 20 (Minimum layoffs) excess number of people
The minimum number of layoffs is 841, and the cost at this time is 1,441,200.
minimum cost
1. Recruit people
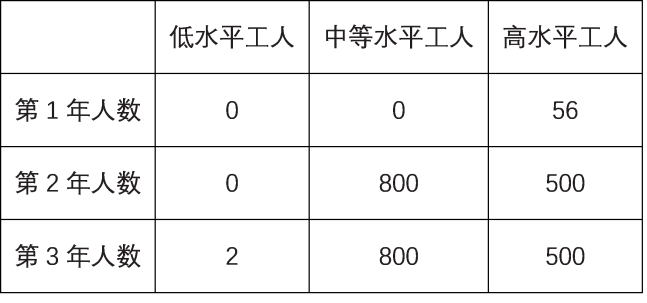
Table 21 (Minimum cost) Number of recruits
2. Train personnel
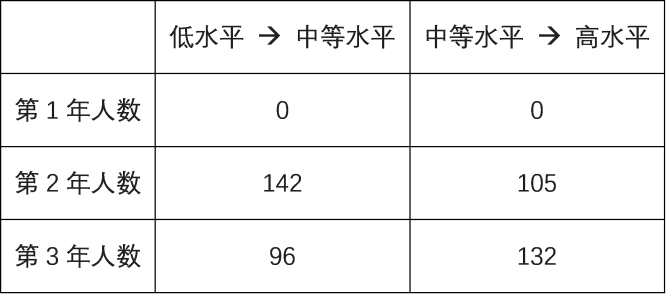
Table 22 (Minimum cost) Number of people trained
3. Demoted Personnel
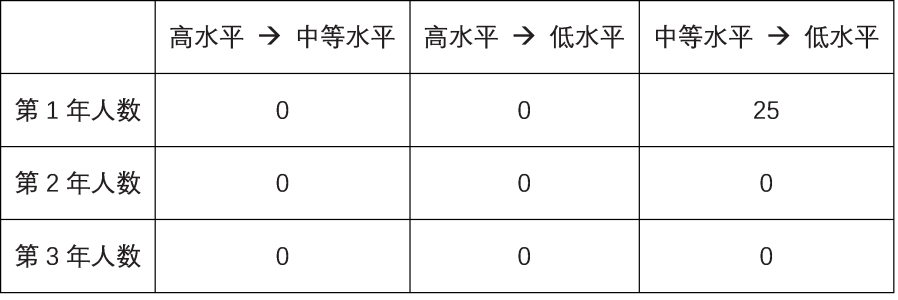
Table 23 (Minimum Spending) Number of Downgrades
4. Layoffs
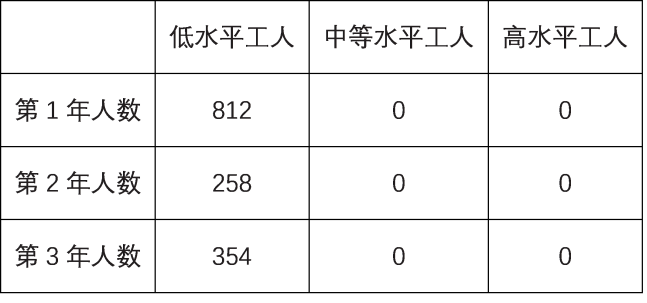
Table 24 (minimum expenditure) number of layoffs
5. Short-term and long-term personnel
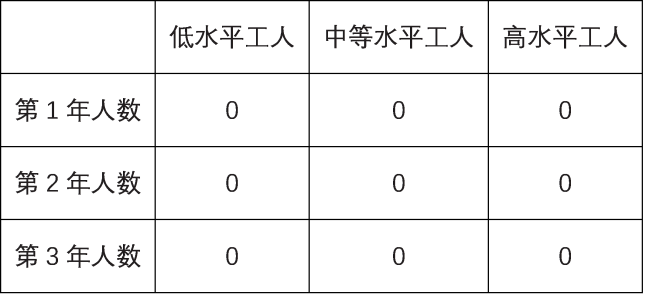
Table 25 (minimum cost) short-term and long-term number of people
6. Surplus manpower
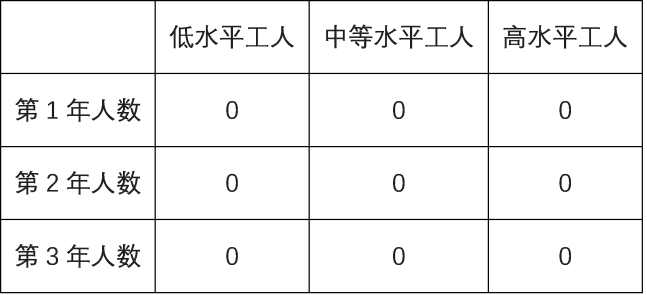
Table 26 (minimum expenditure) excess number of people
The minimum expenditure is 498,500, and the number of layoffs at this time is 1,424. Compared with the case of minimum layoffs, the minimum cost savings is 942,700, and the number of layoffs increases by 583.
5. Video display

Machine-translated from the Chinese original 人力资源规划问题 Manpower Planning (published 2024-10-25). WeChat original ↗