This article is selected from the 35th issue of "Trading Technology Frontier" (June 2019)
Xiong Yun Zhang Yao Chen Jiawei / Shanghai Key Laboratory of Data Science, School of Computer Science and Technology, Fudan University
Xu Guangbin/Shanghai Stock Exchange Capital Market Research Institute
[email protected]
1. Introduction
With the launch and widespread application of the real-time supervision system of the securities market, the efficiency and performance of front-line supervision of the securities market have been greatly improved. In recent years, the introduction of big data technology has shown effects in securities market supervision. However, on the one hand, traditional supervision methods mainly rely on expert experience, that is, rules based on business experts, which require a lot of time from business experts and affect the efficiency and flexibility of supervision; on the other hand, the securities market involves a large amount of transaction data and many trading accounts, and investor trading behaviors change in real time and are complex and diverse. Existing methods do not fully utilize big data, and deep and valuable information may be ignored, making it difficult to achieve a deep and comprehensive portrait of investors, which requires further analysis and organization by analysts.
Deep learning uses deep artificial neural networks to learn multi-level abstract representations of data. It can model data with high dimensions, time sensitivity, correlation and other characteristics, bringing new solutions to investor behavior analysis. It has been widely used in fields such as images, audio and video, and natural language processing, and has also received great attention in fields such as pattern recognition.
This article is based on the IGE (Interaction Graph Embedding) algorithm [1] proposed by the author for behavioral feature analysis based on deep learning, and designs an investor profile generation and analysis framework (hereinafter referred to as the "Investor Profile Framework") based on the incremental needs and complex characteristics of securities trading behavior data. After application analysis, the investor portrait framework can effectively build an investor portrait template library, achieve rapid identification and classification of investors, and provide methodological support for securities market supervision.
This article believes that the investor profiling model based on deep learning has many potential advantages when applied in the field of investor identification and behavior analysis, and can be continuously explored and improved in combination with more business scenarios.
2. Investor portrait framework
The investor profiling framework can convert raw data to obtain in-depth characteristics of investors, build investor portrait templates, and implement investor classification and other possible investor supervision in practical applications. The core of this method is the DL4Profiling model, which is introduced in Section 3 for details.
(1) Panoramic depth analysis
Traditional feature extraction only makes simple changes to the original data and cannot fully capture the more complex and abstract concepts in the information. In view of the high-dimensional, time-sensitive, dynamic, and complex correlation characteristics of securities transaction data, this investor profiling framework uses deep learning methods to extract highly abstract characteristics of investor transaction behavior data and learn multi-level abstract representation of the data. The input of this framework is investors' trading behavior data, and the output is in-depth portraits of investors. Based on the in-depth portraits of investors, analysis models can be used according to application requirements. For example, the unsupervised/semi-supervised clustering and classification models used in this article identify and classify hot money accounts, etc., for further investor analysis, as shown in Figure 1.
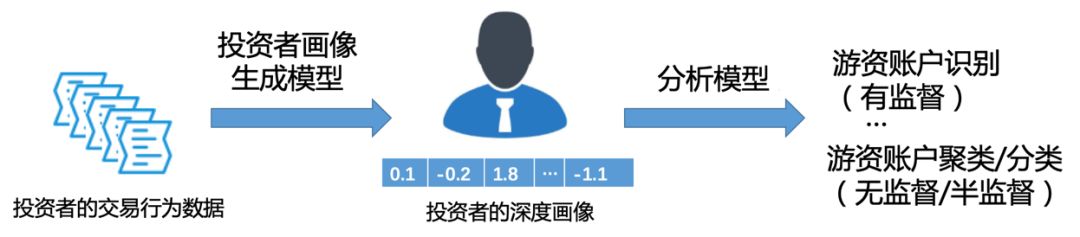
Figure 1 In-depth analysis of investor transaction data
(2) Fast and scalable
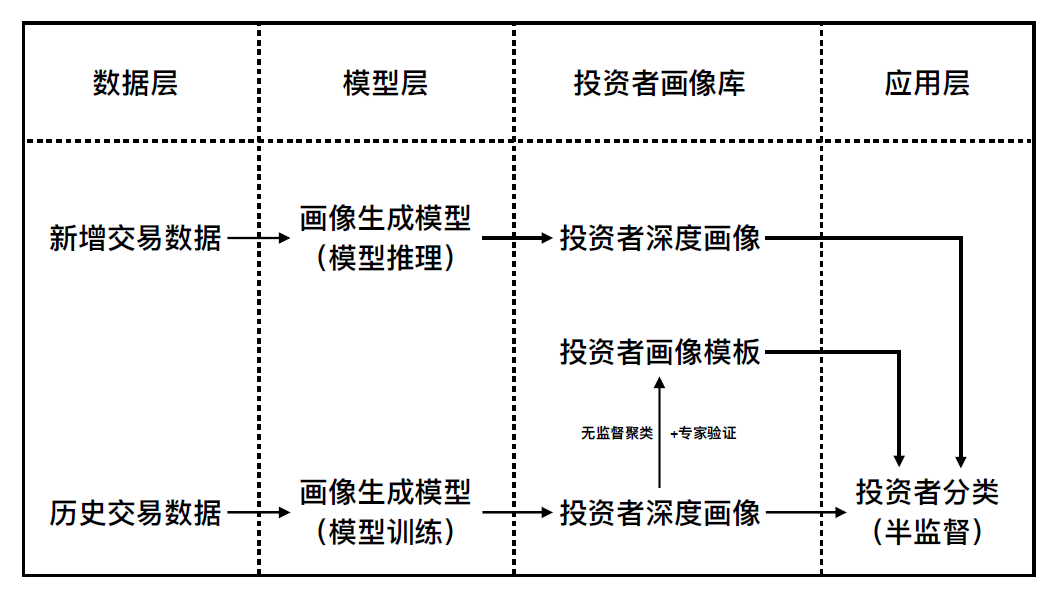
The investor portrait framework can be divided into two parts: the investor portrait generation model and the analysis model. The generative model adopts an inductive learning method and utilizes predictive coding and generative networks to generate investor profiles directly from historical transaction data. For specific business scenarios, the analysis model uses unsupervised clustering/semi-supervised classification methods to apply investor profiles, realizing automated investor analysis from transaction data feature representation to unsupervised clustering/semi-supervised classification results. The relevant analysis process is shown in Figure 2.
Figure 2 Investor analysis framework flow chart
After the investor portrait framework is trained based on historical data, for new transaction data, the transformed data can be used to directly obtain in-depth portraits of investors through the trained portrait generation model. The in-depth investor portraits generated from new data can be combined with the investor portraits obtained through historical data training to classify investors through semi-supervised learning, which is fast and scalable.
(3) Comprehensibility and analytical advantages
This article classifies common feature extraction methods into two categories - manual feature extraction and deep learning feature extraction, and compares them with the investor profiling model used in this article. These three types of methods have their own advantages and disadvantages in terms of information coverage, business knowledge dependence, understandability and subsequent analysis.
Table 1 Comparison of various feature extraction methods[2]
|
|
information covered | Business knowledge dependence | understandability | Follow-up analysis |
| Manual feature extraction | ☆ | ☆ | ☆☆☆ | ☆☆ |
| Deep learning feature extraction | ☆☆☆ | ☆☆☆ | ☆ | ☆ |
| Investor portrait model | ☆☆☆ | ☆☆☆ | ☆☆ | ☆☆☆ |
Manual feature extraction refers to the analysis and manual processing of data by professionals to obtain appropriate feature values. It is a traditional feature extraction method. This method has good results when there is sufficient manual investment. Taking the false declaration of hot money accounts as an example, professionals can make judgments based on artificial characteristics such as the number of orders, the proportion of the number of orders in the market buying volume at the time of the order, the amount of the order, and whether the order has been cancelled, and combined with transaction records. However, in the context of big data, due to manpower limitations, this method has the shortcomings of less information coverage, poor real-time performance, and reliance on business knowledge, which is not conducive to generalization.
Deep learning feature extraction refers to the process of extracting highly abstract features from transaction data using deep learning algorithms. It is a method with multi-layer representation learning capabilities that can cover information as much as possible and reduce dependence on business knowledge. However, the features obtained by deep learning are often difficult to understand due to their highly abstract characteristics, making subsequent analysis difficult.
Investor portrait is a collection of characteristics that comprehensively depicts investors. What this article uses is learning of the constituent elements of deep user portraits based on deep learning. While retaining the advantages of deep learning feature extraction, it combines subsequent supervised/unsupervised learning methods to achieve user classification/clustering, strengthen the interpretability of investor portrait features, and enable subsequent analysis.
3. Introduction to core algorithms
The difficulty in implementing investor behavior analysis is the multi-level abstract representation of investors’ complex behavioral data. The investor profiling framework proposed in this article is called the DL4Profiling model, which consists of two parts: the investor profiling generation model receives the investor's trading behavior data as input and returns its corresponding in-depth portrait; the analysis model uses the in-depth portrait obtained by the generation model as input, and according to the application requirements, the output is the cluster/class to which the investor belongs.
(1) Input and output
Enter the transaction behavior data of accepted investors, including investor code, stock code, transaction time and transaction attributes, etc. Transaction attributes are relevant indicators selected based on the actual transaction conditions that can reflect the characteristics of the transaction. For example, in the identification of hot money accounts, the transaction attribute variables are 15 business indicators such as the maximum transaction proportion on the day and the selling volume of the next day. Input is as shown in Table 2.
Table 2 DL4Profiling model input variable sample table
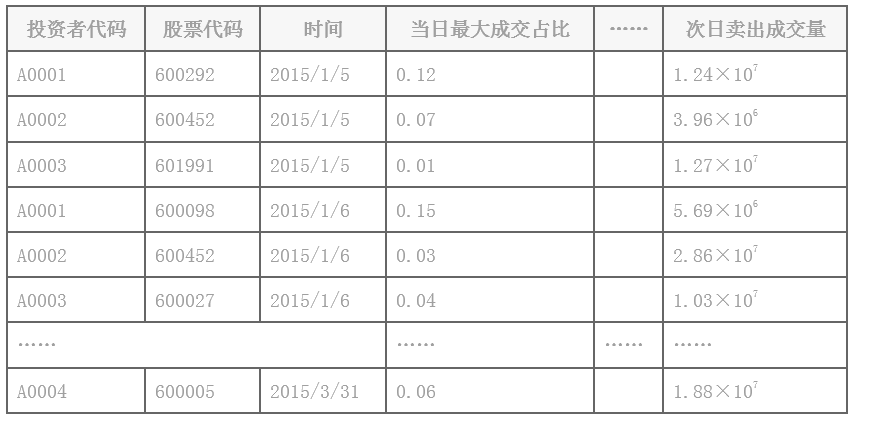
The output of the generative model is an in-depth portrait of the investor, that is, a d-dimensional feature vector; the output of the analytical model is determined according to the application requirements. For example, it can be N categories of investors, etc. Taking 5 categories of investors as an example, the output of the analytical model is shown in Table 3.
Table 3 Sample table of output variables of DL4Profiling model (main value ranges of various attributes for investors in the cluster)
| Properties | cluster 1 | Cluster 2 | Cluster 3 | Cluster 4 | Cluster 5 |
| Purchase point of the day | (8.37E-02, 9.48E-01) | (5.03E-01, 9.48E-01) | (1.35E-01, 5.27E-01) | (7.52E-02, 4.29E-01) | (2.77E-01, 7.29E-01) |
| Purchase declaration volume on the day | (-INF, 8.64E+04) | (1.24E+03, 3.91E+06) | (-INF, 1.11E+08) | (1.76E+07, +INF) | (5.43E+05, 5.79E+07) |
| Purchase volume on the day | (7.09E+03, 4.75E+06) | (9.01E+02, 8.26E+04) | (5.25E+04, 6.02E+05) | (1.61E+05, 6.50E+06) | (1.87E+04, 4.53E+05) |
| Selling volume for the next day | (-INF, 7.97E+03) | (2.43E-01, 2.19E+06) | (-INF, 3.79E+07) | (9.82E+06, +INF) | (4.52E+04, 5.44E+07) |
| Selling volume for the next day | (-INF, 2.80E+03) | (2.43E-01, 7.27E+04) | (-INF, 1.77E+05) | (1.38E+05, +INF) | (9.91E+03, 3.32E+05) |
| The total trading volume of the day | (3.45E+05, 2.40E+08) | (2.19E+04, 3.82E+06) | (2.76E+06, 2.55E+07) | (8.41E+06, 5.11E+08) | (9.23E+05, 1.50E+07) |
| The total number of withdrawals on the day | (1.60E+04, 2.68E+08) | (4.80E+03, 1.47E+06) | (5.03E+01, 6.39E+06) | (2.64E+06, 4.44E+08) | (1.58E+05, 9.41E+06) |
(2) Main processes of DL4Profiling
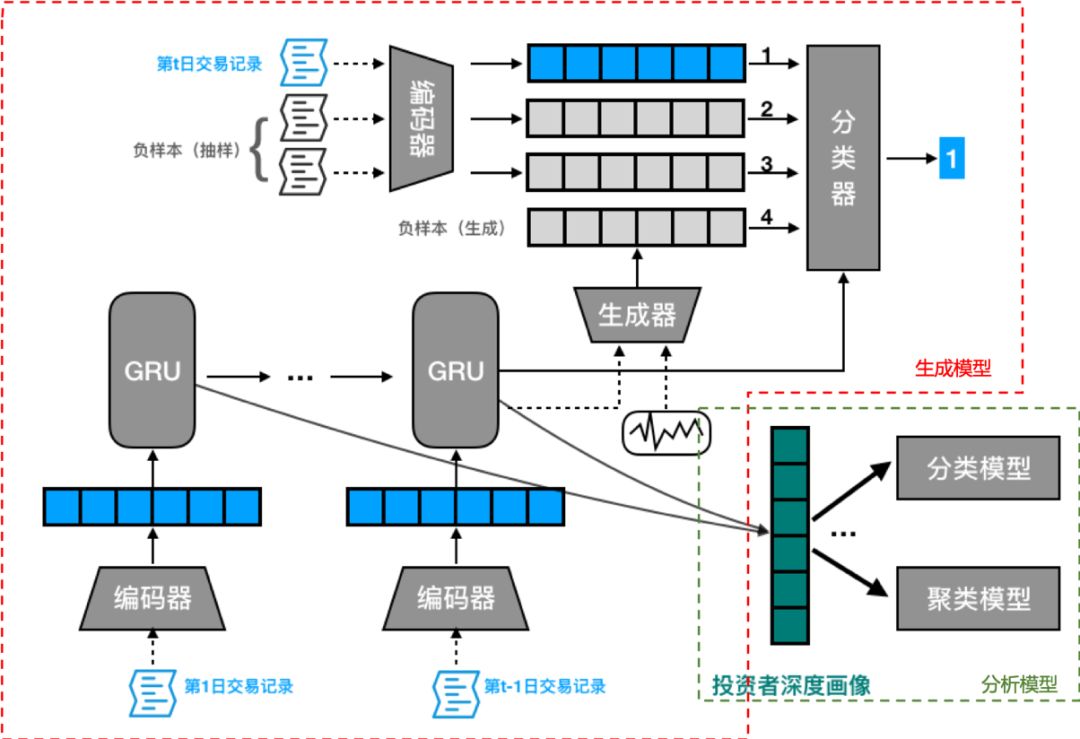
The process of the DL4Profiling model is shown in Figure 3.
Figure 3 DL4Profiling model flow chart
The DL4Profiling model consists of a daily transaction record encoder, a predictive encoder (including a generator and a classifier), and an investor depth profile generation and representation model.
The model receives an investor's transaction data as input, investor code, stock code, transaction time and transaction attributes as daily transaction records. The daily transaction records first pass through the daily transaction record encoder to obtain their feature vectors, and then are input into the recurrent neural network. We adopt the idea of predictive coding: after receiving several days of data, the recurrent neural network predicts the future, that is, using a classifier to distinguish the correct data at the next moment from the negative samples. Finally, an in-depth portrait of the investor is constructed from the hidden state of the trained recurrent neural network at each time point, which is used for subsequent unsupervised clustering/semi-supervised classification analysis models. Each component of the model is explained one by one below.
1) Daily transaction record encoder
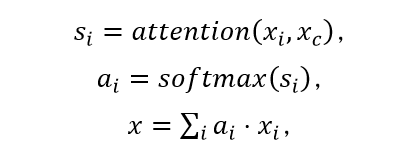
The daily transaction record encoder is shown in Figure 4. Given an investor’s daily transaction record on a certain day e={(codei,attrsi )}i=1M, where codeiFor traded stocks, attrsi∈RmFor the corresponding m-dimensional attribute, we encode it as a fixed-length vector. The first step is to perform a single record (codei,attrsi) for feature representation. First, the stock code is mapped to its vector representation through the embedding layer Emb.. The original attribute vector also obtains a vector through the fully connected layer FC. After splicing these two vectors, the feature representation x of the record is obtained through the fully connected layer FC.i. In this way, each record in e can be characterized. After that we will xiSummary through self-attention mechanism:
Among them, the attention function uses the inner product attention(xi,xc )=xiT xc,xcare the parameters of the self-attention module. The finally obtained vector x can be used as the encoded feature vector of the transaction record of that day. The daily transaction record encoder proposed in this framework can effectively handle variable-length sequences. At the same time, it uses an attention mechanism to dynamically assign different weights to different stocks, and then fuses them to generate an effective daily transaction record feature representation.
Figure 4 Daily trading encoder (Emb. represents the embedding layer, FC represents the fully connected layer)
2) Predictive encoder
The predictive encoder is shown in Figure 5, including an encoder and a generator. The encoder part is the feature vector obtained through the daily transaction record encoder, and the hidden state is obtained through the recurrent neural network of the GRU architecture:
Among them, h_i is the hidden state at the i-th moment.
After obtaining the hidden state at the current moment, according to the idea of predictive coding, future information needs to be predicted, that is, the model should be able to correctly identify the sample at the next moment from the real input and negative samples at the next moment. The training objective is defined as minimizing the cross-entropy loss function:
Considering that the data in the securities market itself has strong time dependence, randomly selected negative samples are easy to identify, that is, the classifier can easily distinguish positive and negative samples, and the model cannot be effectively trained. Therefore, we use the idea of generative adversarial networks to generate high-quality negative samples. GeneratorG(ht-1,z) is a multi-layer fully connected network, receiving the state h of the previous momentt-1As input, time-dependent samples are generated; in addition, the generator also receives the noise vector z to ensure the diversity of the generated samples. We input the samples generated by the generator as negative samples into the discriminator to help the model train better.
Figure 5 Predictive encoder
3) Investor in-depth portrait generation representation
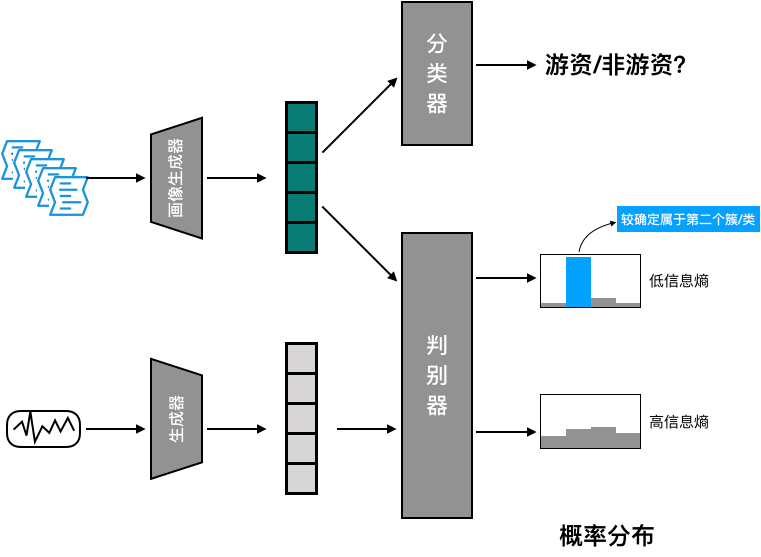
Given the generated in-depth investor portraits, the analysis model is shown in Figure 6. A discriminative investor clustering model is constructed based on the category-based generative adversarial network. The model is completely differentiable, and the gradient can be passed back to the portrait generation model for optimization. First, investors are clustered through an unsupervised model, and the results are checked by domain experts. After confirmation, an investor portrait template library can be constructed and fed back to the model as labeled data. The model is then converted into a semi-supervised classification model to improve the discrimination performance. In this method, domain experts only need to check the results of model recognition, which greatly reduces the burden of domain experts in labeling label data and improves labeling efficiency.
Figure 6 Investor in-depth portrait analysis model
4. Application case analysis
In recent years, under the background of economic and financial globalization, the accumulation of large amounts of funds has gradually accelerated. At the same time, hot money has an increasing impact on the economies of various countries. In order to obtain high profits, hot money has adopted some operations and methods that are harmful to the normal operation of the market, which has had a certain impact on our country's economy. Therefore, it is very necessary to strengthen the supervision of these hot money.
Traditional human supervision methods require time and labor costs, from identifying hot money, verifying its behavior that harms the market, to finally imposing regulatory penalties on hot money accounts. We apply the model proposed above to the analysis of hot money accounts.
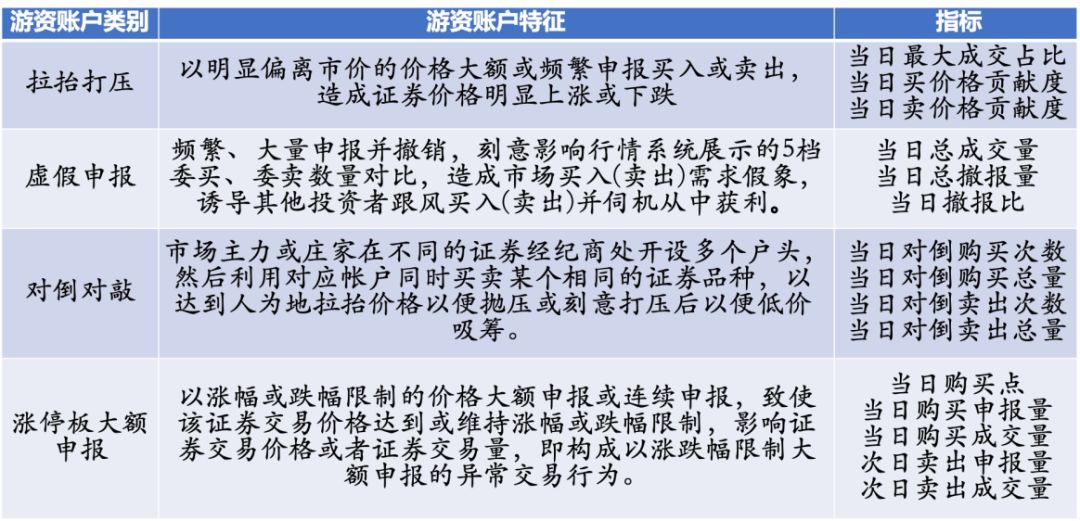
Hot money accounts refer to accounts that manipulate a large amount of funds through a single account or account group, disrupt the normal trading order, and manipulate the securities market by virtue of their financial advantages. Hot money accounts mainly have the following three characteristics: high returns, high sensitivity, and high liquidity. The above characteristics are reflected in the transaction process: the transaction amount is huge, the market situation is well grasped, and the transactions are concentrated in a short period of time according to the market situation. Among them, strong liquidity is mainly reflected in the short-term nature of the trading behavior of such accounts, with rapid entry and exit within one to two trading days or within a week, and common operations such as boarding. Based on the above-mentioned characteristics of hot money, and based on the situations that occur in actual transactions, hot money accounts can be organized into four categories as shown in Figure 7—pumping and suppressing, false declarations, counter-attacks, and large-amount declarations at the daily limit. And with reference to the administrative penalty decisions of the China Securities Regulatory Commission, relevant indicators that can reflect its characteristics are selected as model inputs.
Figure 7 Classification of hot money accounts
This article conducts experiments using hot money accounts in the first three quarters of 2015, with a total of 1,493 pieces of hot money transaction sequence data, and extracts other 9,000 accounts from the entire market as non-hot money accounts. After certain preprocessing of the data, first, a two-classification problem—the identification of hot money and non-hot money accounts—is used to illustrate the effectiveness of the investor profile generation algorithm. Using the proposed DL4Profiling model, the account depth profile was obtained through training, p% of the data was randomly selected as the training set, and (100-p)% of the data was used as the test set. The results are shown in Table 4.
Table 4 Effect of DL4Profiling model on identifying hot money accounts
The above table shows the accuracy (Accuracy), F1 score and AUC score of the training set and test set when the test ratio is 20%, 40%, 60% and 80%. As can be seen from the table above, the experimental results have a certain degree of stability, and the evaluation indexes fluctuate little. The training set values are slightly larger than the test set values, but the difference is not large, indicating that the model results have certain generalization performance, and the evaluation index values are all at a high value, indicating that the model in this article has good prediction effects.
Figure 8 shows the ROC and PRC when p=50
Figure 8 ROC curve and PRC curve
It can be seen from the ROC curve that the DL4Profiling model proposed in this article has a very good effect as a binary classifier. The curve is very close to the upper left corner, indicating that the model has good separability in distinguishing positive and negative classes. When hot money and non-hot money accounts are mixed, this model can correctly determine whether an account is hot money and has a low misjudgment rate. Since hot money accounts account for a small proportion of the total accounts, this article draws the PRC curve as a reference. The PRC curve is very close to the upper right corner, indicating that both accuracy and recall have good effects. In terms of classifying hot money and non-hot money accounts, the model has good separability in each category.
It can be seen from the results that even using only a simple linear classifier, we can effectively identify hot money accounts, with an accuracy of nearly 97% on the test set, indicating that the DL4Profiling model proposed in this article can indeed capture the deep characteristics of investors, which is beneficial to the analysis of subsequent tasks.
In addition, we use an analytical model to cluster hot money accounts, and the input to the model is still the investor's transaction sequence. Since hot money accounts are not limited to the four categories mentioned above, and there may also be some potential but undiscovered hot money categories, we chose to cluster them into five clusters, hoping that the clustering results would correspond to the four categories of hot money accounts previously described in this article, and on this basis, the remaining cluster was regarded as a new fifth category of hot money accounts. In practical applications, we can use it as a detection standard for new hot money account types.
Since each investor account has multiple days of transaction records and several transactions every day, in order to facilitate the analysis of clustering results, we calculated 8 statistics of each indicator on all investor transaction records based on the 15 business indicators used previously (the proportion of the largest transaction on the day, the contribution of the buying/selling price on the day, etc.) as summary features. Including the average value, variance, minimum value, maximum value, 25th percentile value, 50th percentile value, 75th percentile value and non-zero ratio of each indicator in all transaction records. Finally, 15*8=120 features were obtained as the global characteristics of an investor.
We visualize the clustering results in the following way: Draw them based on the numerical size and color distinction. Blue represents small values, red represents large values. The darker the color, the greater the absolute value of the numerical value, which is drawn as ni×120-dimensional matrix (nirepresents the number of accounts in the i-th cluster), and the row represents the account (n in each clusteriaccounts), the columns represent features (120), among the 120 columns, 7 statistics are first grouped, and columns 1-105 represent the average, variance, minimum value, maximum value, 25th percentile value, 50th percentile value and 75th percentile value of each of the 15 features. The order of the 15 features is the maximum transaction proportion of the day, the purchase price of the day Contribution, selling price contribution of the day, number of counter purchases on the day, total counter purchases on the day, number of counter sells on the day, total counter selling volume on the day, total trading volume on the day, total withdrawal volume on the day, withdrawal ratio on the day, buying point on the day, purchase order volume on the day, purchase volume on the day, sell order volume on the next day, and sell volume on the next day. The last 106-120 columns represent the non-zero proportion of user feature values in order of the above 15 features. With 120 columns arranged in this way, the result is shown in Figure 9:
Figure 9 Visualized clustering results
As can be seen from the above results, we can intuitively find the distinguishing points between different categories through color. In the columns at the beginning, middle and end of the row, we can observe the color characteristics of different clusters, that is, the numerical characteristics of the features.
Take cluster 2 and cluster 3 as an example (Figure 10). The red color displayed at the end of cluster 2 is distinguished from other clusters in the corresponding characteristic value non-zero proportion indicator. Regarding the non-zero proportion of selling volume on the next day, the average value of cluster 2 is 68.53%, while the average value of other clusters is 36.14%, which is much lower than the value of cluster 2. This characteristic value can be used to represent the proportion of the account that buys the same stock that day and sells it the next day. Here it is named the next-day selling rate. The next-day selling rate of cluster 2 is much higher than that of other clusters. The numerical characteristics of this indicator correspond to the hot money accounts with large-amount declarations at the daily limit. It can be concluded that cluster 2 corresponds to the hot-money accounts with large-amount declarations at the daily limit.
The blue color shown in the middle and front part of cluster 3 is distinguished from other clusters in the corresponding indicators of the number of reverse purchases on the day, the total amount of reverse purchases on the day, the number of reverse sells on the day, and the total amount of reverse sells on the day. The average value of cluster 3 on these four indicators is 33 times, 7.24×10⁶strands, 35 times and 7.45×10⁶stocks, while the average value of other clusters on these four indicators is 16 times, 3.12×10⁶shares, 21 times and 3.51×10⁶For stocks, the numerical characteristics of these four indicators in cluster 3 correspond to the hot money accounts of the opposite type. It can be concluded that cluster 3 corresponds to the hot money accounts of the opposite type.
Figure 10 Visualization results of cluster 2 and cluster 3 after zooming in
The four clusters obtained by clustering correspond to four types of hot money accounts, and the remaining cluster 5 is considered to be a potential new type of hot money accounts or hot money accounts with cross-behaviors, that is, multiple hot money behaviors. In addition, several types of clusters often overlap in the distinction points. For example, the intra-day withdrawal ratio indicator of cluster 1 is higher than that of the remaining three clusters, and is close to cluster 4, at 21.7%. This phenomenon is consistent with the overlap of hot money accounts that promote and suppress hot money accounts and hot money accounts that make false declarations. It also illustrates the credibility of the qualitative classification of clusters in this article.
Based on the above clustering results, the value range of each type of attribute value that is different from other categories is given by calculating the information gain, and representative results are selected and presented in the form of investor portraits, as shown in Figure 11.
Figure 11 Investor portrait
According to the above figure, it can be seen that the most significant attributes of the cluster on the left (hot funds with large daily limit declarations) are the purchase point of the day, the maximum transaction ratio of the day, etc.; the cluster on the right (hot funds with false declarations) is the total withdrawal volume of the day, the volume of sell declarations the next day, etc., which is in line with the behavioral characteristics of this type of hot money. It can be seen that the results after clustering have a certain degree of separability and can effectively distinguish sub-categories of hot money accounts. This further illustrates that the DL4Profiling model in this article has good results and can achieve the purpose of building an investor profile library.
5. Summary
After analysis, this article draws the following conclusions.
First, the investor profiling framework proposed in this article has the potential to analyze investor behavior. The DL4Profiling model can capture the in-depth characteristics of investors and use them for subsequent analysis. In the case of this article, the investor profiling framework shows certain effectiveness.
Second, the investor profiling framework can study more business scenarios, build different analysis models based on actual business needs, design analysis models and combine them with the profiling model, and apply more research results in the field of deep learning to the securities market.
References
1. Yao Zhang, Yun Xiong, Xiangnan Kong, Yangyong Zhu.2017. Learning Node Embeddings in Interaction Graphs. In Proceedings of International Conference on Information and Knowledge Management, Pan Pacific Singapore, November 6-10, 2017 (CIKM’17), 10 pages.
2. Niu Zhuang, Xiong Yun, Zhang Yao. Research on automatic identification method of investor types based on artificial intelligence. Frontiers of Trading Technology. Issue 28. 2017.
Machine-translated from the Chinese original 【交易技术前沿】投资者行为数据表示与画像 (published 2020-03-19). WeChat original ↗